Get Indexology® Blog updates via email.

In This List

Rates, Risk and Relative Value

Performance Insights: The S&P 500 Equal Weight ESG Index

The Market Measure

Tracking the Companies Feeding the World with Indices

2024 S&P U.S. Style Indices Rebalancing: Key Sector Shifts and Impacts

Rates, Risk and Relative Value

Contributor Image
Anu Ganti

Head of U.S. Index Investment Strategy

S&P Dow Jones Indices

It is clear that the rapid rise of the 10-year U.S. Treasury yield could have significant implications for active bond manager performance, as well as bond market volatility dynamics. But how might this affect the equity market? Another important role of U.S. Treasury yields is to act as a risk-free rate to compare to the market return, the excess return of which is known as the equity risk premium.

Coupled with rising yields and continuous record highs for the stock market, Exhibit 1 shows that the S&P 500® equity risk premium, measured here as the difference between the S&P 500 trailing 12-month earnings yield versus the 10-year U.S. Treasury yield, has plummeted over the past year, most recently entering negative territory. The last time the equity risk premium was below zero was following the burst of the Tech bubble during the early 2000s.

While the equity risk premium may indicate that equities seem relatively expensive compared to bonds, we do caveat that as of Jan. 21, 2025, Q4 2024 S&P 500 earnings season has started off on a solid note, particularly among the big banks, and if earnings growth continues, that might help to support current valuations.

We can also analyze equities and bonds from an income lens by comparing the market’s dividend yield to 10-year U.S. Treasury yields. Exhibit 2 illustrates that the yield on the 10-year U.S. Treasury of 4.6% has significantly outpaced the S&P 500 trailing 12-month dividend yield, which has declined over the past couple of decades to 1.3% as of Jan. 17, 2025.

Bonds may seem relatively better positioned from a valuation and income vantage point, but their diversification potential is also interesting to examine. We observe in Exhibit 3 that correlations between equities and bonds, as measured by The 500™ and S&P U.S. Treasury Bond Current 10-Year Index, have recently turned negative. After witnessing positive correlations for most of 2024, this reversal, if sustained, might be indicative of a tailwind for enhanced risk-adjusted performance for combinations of both asset classes.

As we enter a new presidential regime, filled with many uncertain variables, we may not know the future trajectory of bonds or equities, but understanding their historical value, income and diversification characteristics could aid investors to adapt accordingly.


The posts on this blog are opinions, not advice. Please read our Disclaimers.

Performance Insights: The S&P 500 Equal Weight ESG Index

Contributor Image
Maya Beyhan

Global Head of Sustainability, Index Investment Strategy

S&P Dow Jones Indices

Since its launch in July 2022 to year-end 2024, the S&P 500® Equal Weight ESG Index achieved a cumulative outperformance of 0.86% compared to its benchmark, the S&P 500 Equal Weight Index. Gaining insight into the factors behind this outperformance highlights important aspects of environmental, social and governance (ESG) attributes that function differently from those in market-cap indices like the S&P 500 ESG Index.

To investigate the ESG attributes contributing to the S&P 500 Equal Weight ESG Index’s performance, we created hypothetical ESG quintile compositions by count and reconstituted them annually. This was done by ranking the S&P 500 Equal Weight Index’s constituents based on their ESG scores and assigning them to one of the five compositions, from highest to lowest ESG score, akin to previous assessments1 conducted on the S&P 500 ESG Index. The hypothetical equal-weighted performance of these compositions was then calculated and used to create a Brinson-like ESG attribution analysis,2 teasing out the importance of ESG score exposures in the performance of the S&P 500 Equal Weight ESG Index.

Exhibit 1 illustrates the results of this analysis, measuring the contribution of ESG quintile weighting and stock selection effects to the S&P 500 Equal Weight ESG Index’s excess return relative to the S&P 500 Equal Weight Index since its launch.3 To emphasize the relative impact of ESG quintile weighting and stock selection effects, the exhibit shows the proportion of the total impact, with their absolute values summing to 100% and the actual return impact shown in the labels.

Our findings reveal that the S&P 500 Equal Weight ESG Index’s performance was predominantly driven by stock selection effects rather than ESG quintile weighting effects. Specifically, stock selection contributed 2.65% to the index’s excess return, while ESG quintile weighting had a negative impact of 1.79%. This resulted in a total cumulative excess return of 0.86%. Of the five ESG quintiles, the ESG quintile weighting effect exceeded the stock selection effect in just one: Quintile 1.

This conclusion contrasts with the performance drivers observed in the S&P 500 ESG Index during the same period, as illustrated in Exhibit 2. The S&P 500 ESG Index achieved a cumulative excess return of 0.91% against the S&P 500, with more than 60% of this excess return driven by ESG quintile weighting effects. 4

The varied performance drivers highlight the significant impact that index construction methodologies can have on performance. The S&P 500 Equal Weight ESG Index5 can benefit from an approach that emphasizes the selection of companies with higher ESG scores across market capitalizations. This could enable it to tap into the value generated by smaller firms, which can be overlooked in cap-weighted indices.

As the growing emphasis on sustainable investing continues to shape market participants’ preferences and the drivers of relative performance in the S&P 500 Equal Weight Index6 continue to attract attention, these findings could serve as a crucial reference for market participants looking into this index’s ESG variant. For those interested in exploring more about S&P DJI’s sustainability-focused indices, additional information is available in the Sustainability Index Dashboard.

The posts on this blog are opinions, not advice. Please read our Disclaimers.

1 For a thorough description of the hypothetical ESG quintile compositions and the drivers behind the excess return in the S&P 500 ESG Index, see Beyhan, Maya, “Charting New Frontiers,” S&P Dow Jones Indices LLC, Sept. 06, 2024.

2 For more information on this widely used performance attribution model, see Brinson, Gary P., L. Randolph Hood and Gilbert L. Beebower, “Determinants of Portfolio Performance,” Financial Analysts Journal, July-August, 1986.

3 Analysis carried out using Portfolio Analytics on S&P Capital IQ Pro.

4 Analysis carried out using Portfolio Analytics on S&P Capital IQ Pro.

5 See the S&P Equal Weight ESG Indices Methodology.

6 For a thorough overview of the potential sources and drivers of relative performance in the S&P 500 Equal Weight Index, see Ganti, Anu R., Tim Edwards and Hamish Preston, “Worth the Weight,” S&P Dow Jones Indices LLC, July 23, 2024.

The posts on this blog are opinions, not advice. Please read our Disclaimers.

The Market Measure

Explore the dynamics that drove performance trends around the world in 2024 as well as the potential implications of all-time highs for market participants.

The posts on this blog are opinions, not advice. Please read our Disclaimers.

Tracking the Companies Feeding the World with Indices

How can an index-based approach help market participants to measure the evolution of global food production? Learn more about the S&P Commodity Producers Agribusiness Index and how it tracks the companies that help feed the world’s growing population.

The posts on this blog are opinions, not advice. Please read our Disclaimers.

2024 S&P U.S. Style Indices Rebalancing: Key Sector Shifts and Impacts

Contributor Image
Cristopher Anguiano

Associate Director, U.S. Equity Indices

S&P Dow Jones Indices

The S&P U.S. Style Indices underwent their annual rebalancing in December 2024, leading to significant changes in sector exposures. Particularly, the S&P 500 style reclassification led to above-average turnover, as shown in Exhibit 1. While the S&P 500 Growth’s turnover was not unusual, the S&P 500 Value’s turnover was relatively high compared to the historical average of 23%.

The S&P U.S. Style Indices’ methodology aims to divide the market capitalization of the underlying index roughly equally into growth and value indices. Style scores are calculated for each company based on three factors to measure growth and value, as listed in Exhibit 2. The most growth-oriented companies are placed in the growth basket until it represents 33% of the underlying index’s market cap. The same applies to the value basket. The remaining 34% form the blended basket, which has similar growth and value traits.

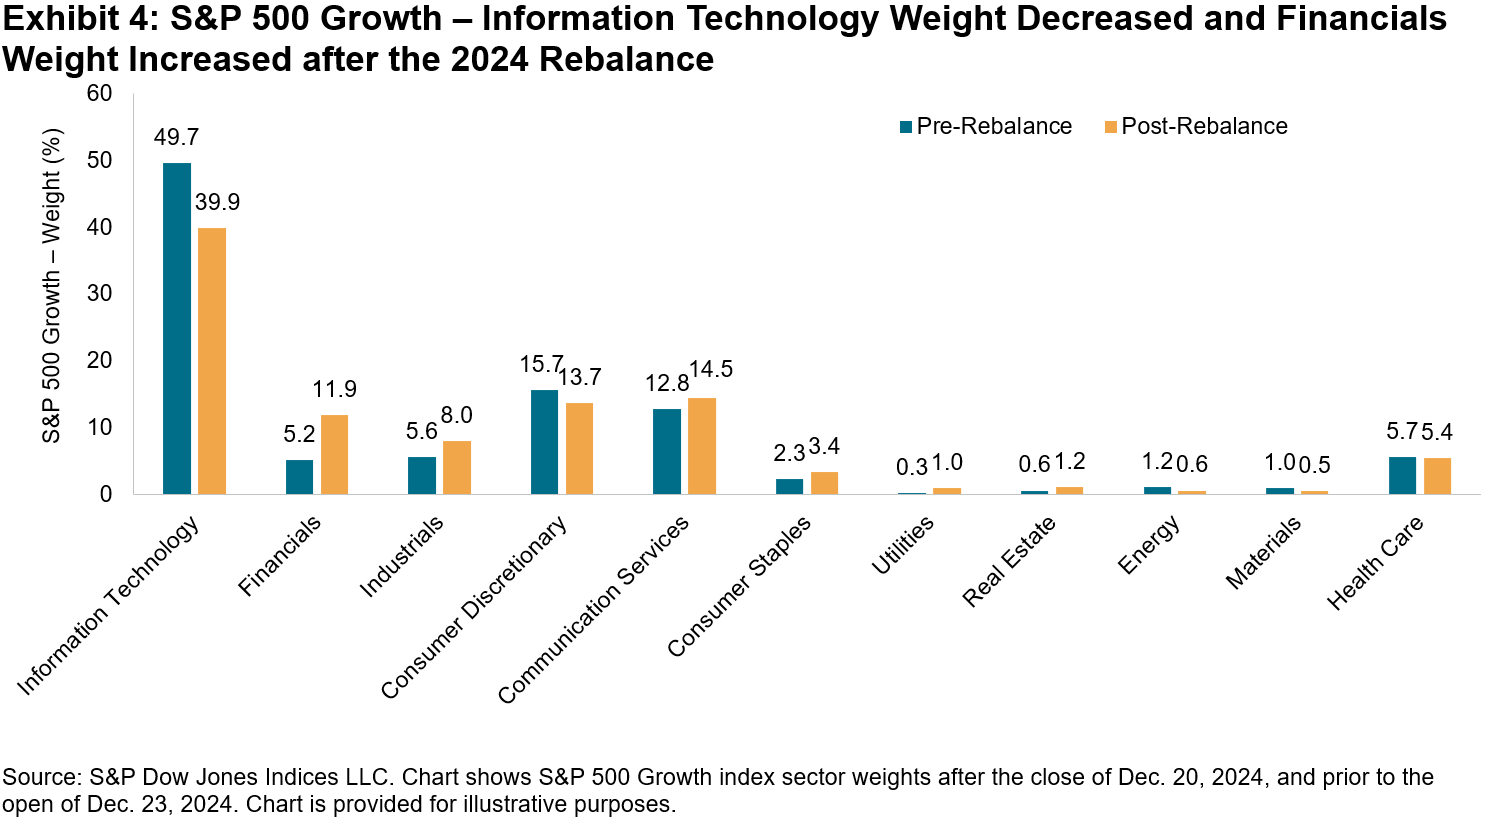
Notably, three of the five largest S&P 500 Growth companies pre-rebalancing—Apple, Microsoft and Amazon (representing 31.3% of the S&P 500 Growth’s weight)—moved to the blended basket. These companies migrated due to a decline in their Growth Score: Apple ranked lower in sales growth and earnings growth relative to the underlying index (the broader basket), while Amazon and Microsoft experienced declines in earnings growth and sales growth relative to the growth basket. Only Microsoft ranked lower in momentum relative to the broader basket.

At the sector level, Exhibits 4 and 5 show that the Information Technology and Financials sectors experienced the most significant changes, followed to a lesser extent by Industrials and Consumer Discretionary. For the S&P 500 Growth, Information Technology decreased from 49.7% to 39.9%, while Financials increased from 5.2% to 11.9%. Historically, this index has been Information Technology-heavy, but its Information Technology weight prior to the latest rebalance reached levels not seen in the past 15 years. The Financials weight almost doubled compared to the historical average of 6%.

In contrast, the S&P 500 Value saw its Information Technology weight roughly triple from 7.9% to 24.8%, while its Financials weight decreased from 25.2% to 15.3%. The index currently has its highest Information Technology weight following the rebalance, while its Financials weight dropped to relatively low levels compared to the historical average of 22% over the past 15 years.

Financials companies ranked high in book value to price and earnings to price, but 30% also ranked high in sales growth and momentum. This caused some companies to move from the value index to the blended basket, increasing their weight in the S&P 500 Growth by 4.1% and decreasing their weight in the S&P 500 Value by 6.0%. Additionally, companies that moved from the blended basket to the value basket resulted in a 2.6% weight increase in the S&P 500 Growth and a corresponding decrease in the S&P 500 Value.

The 2024 S&P U.S. Style Indices’ annual rebalancing led to significant sector shifts, particularly in the Information Technology and Financials sectors of the S&P 500 Growth and S&P 500 Value. These adjustments highlight the dynamic nature of the style indices and how market conditions can affect their composition, ensuring the indices accurately reflect the evolving market landscape.

The posts on this blog are opinions, not advice. Please read our Disclaimers.